


What are the most important KPIs for PR, and how can you measure whether you have achieved them?
Counting how often your organization appears in the media does not give a complete picture of your PR strength. Each industry has a different footprint in media (curling’s is small, soccer’s is very large). So while the number of “clippings” (appearances in media, including radio and television) is undoubtedly the most well-known metric for measuring PR efforts, those absolute numbers don’t always reveal much.
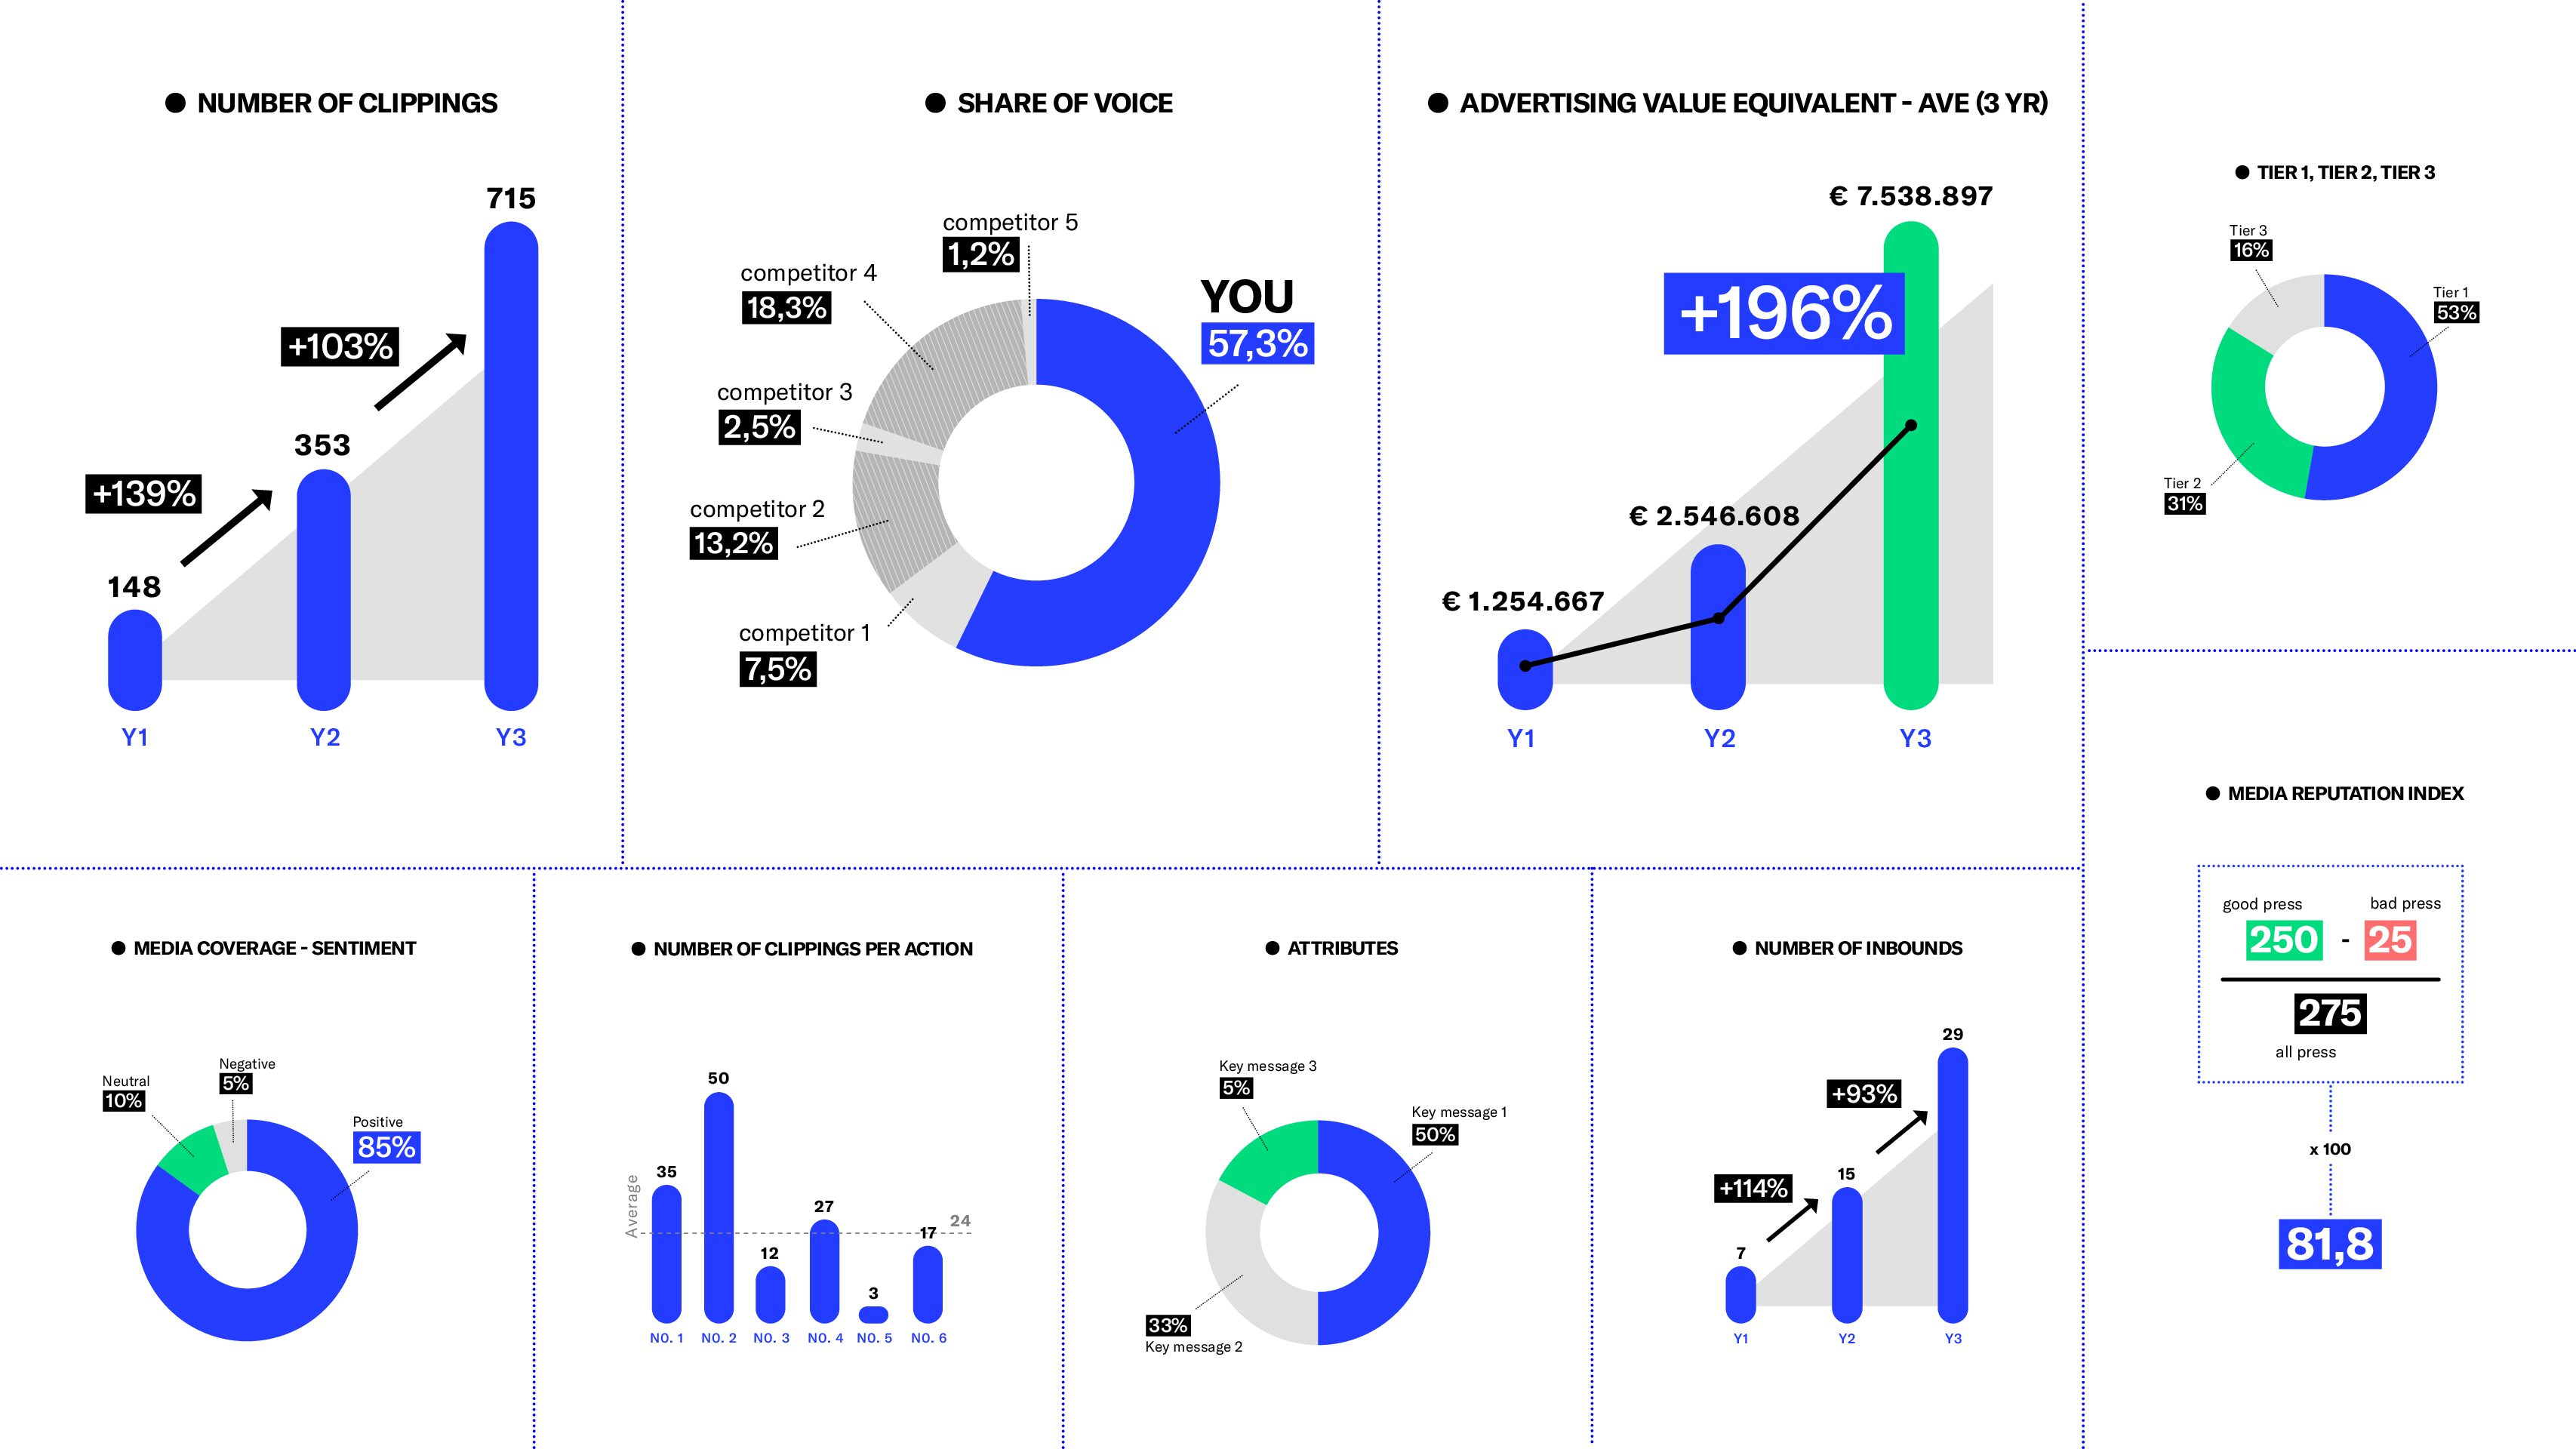
It is smarter to combine a number of metrics if you want to measure your efforts in PR. Here are the main options:
1. Number of clippings for your PR programme per year
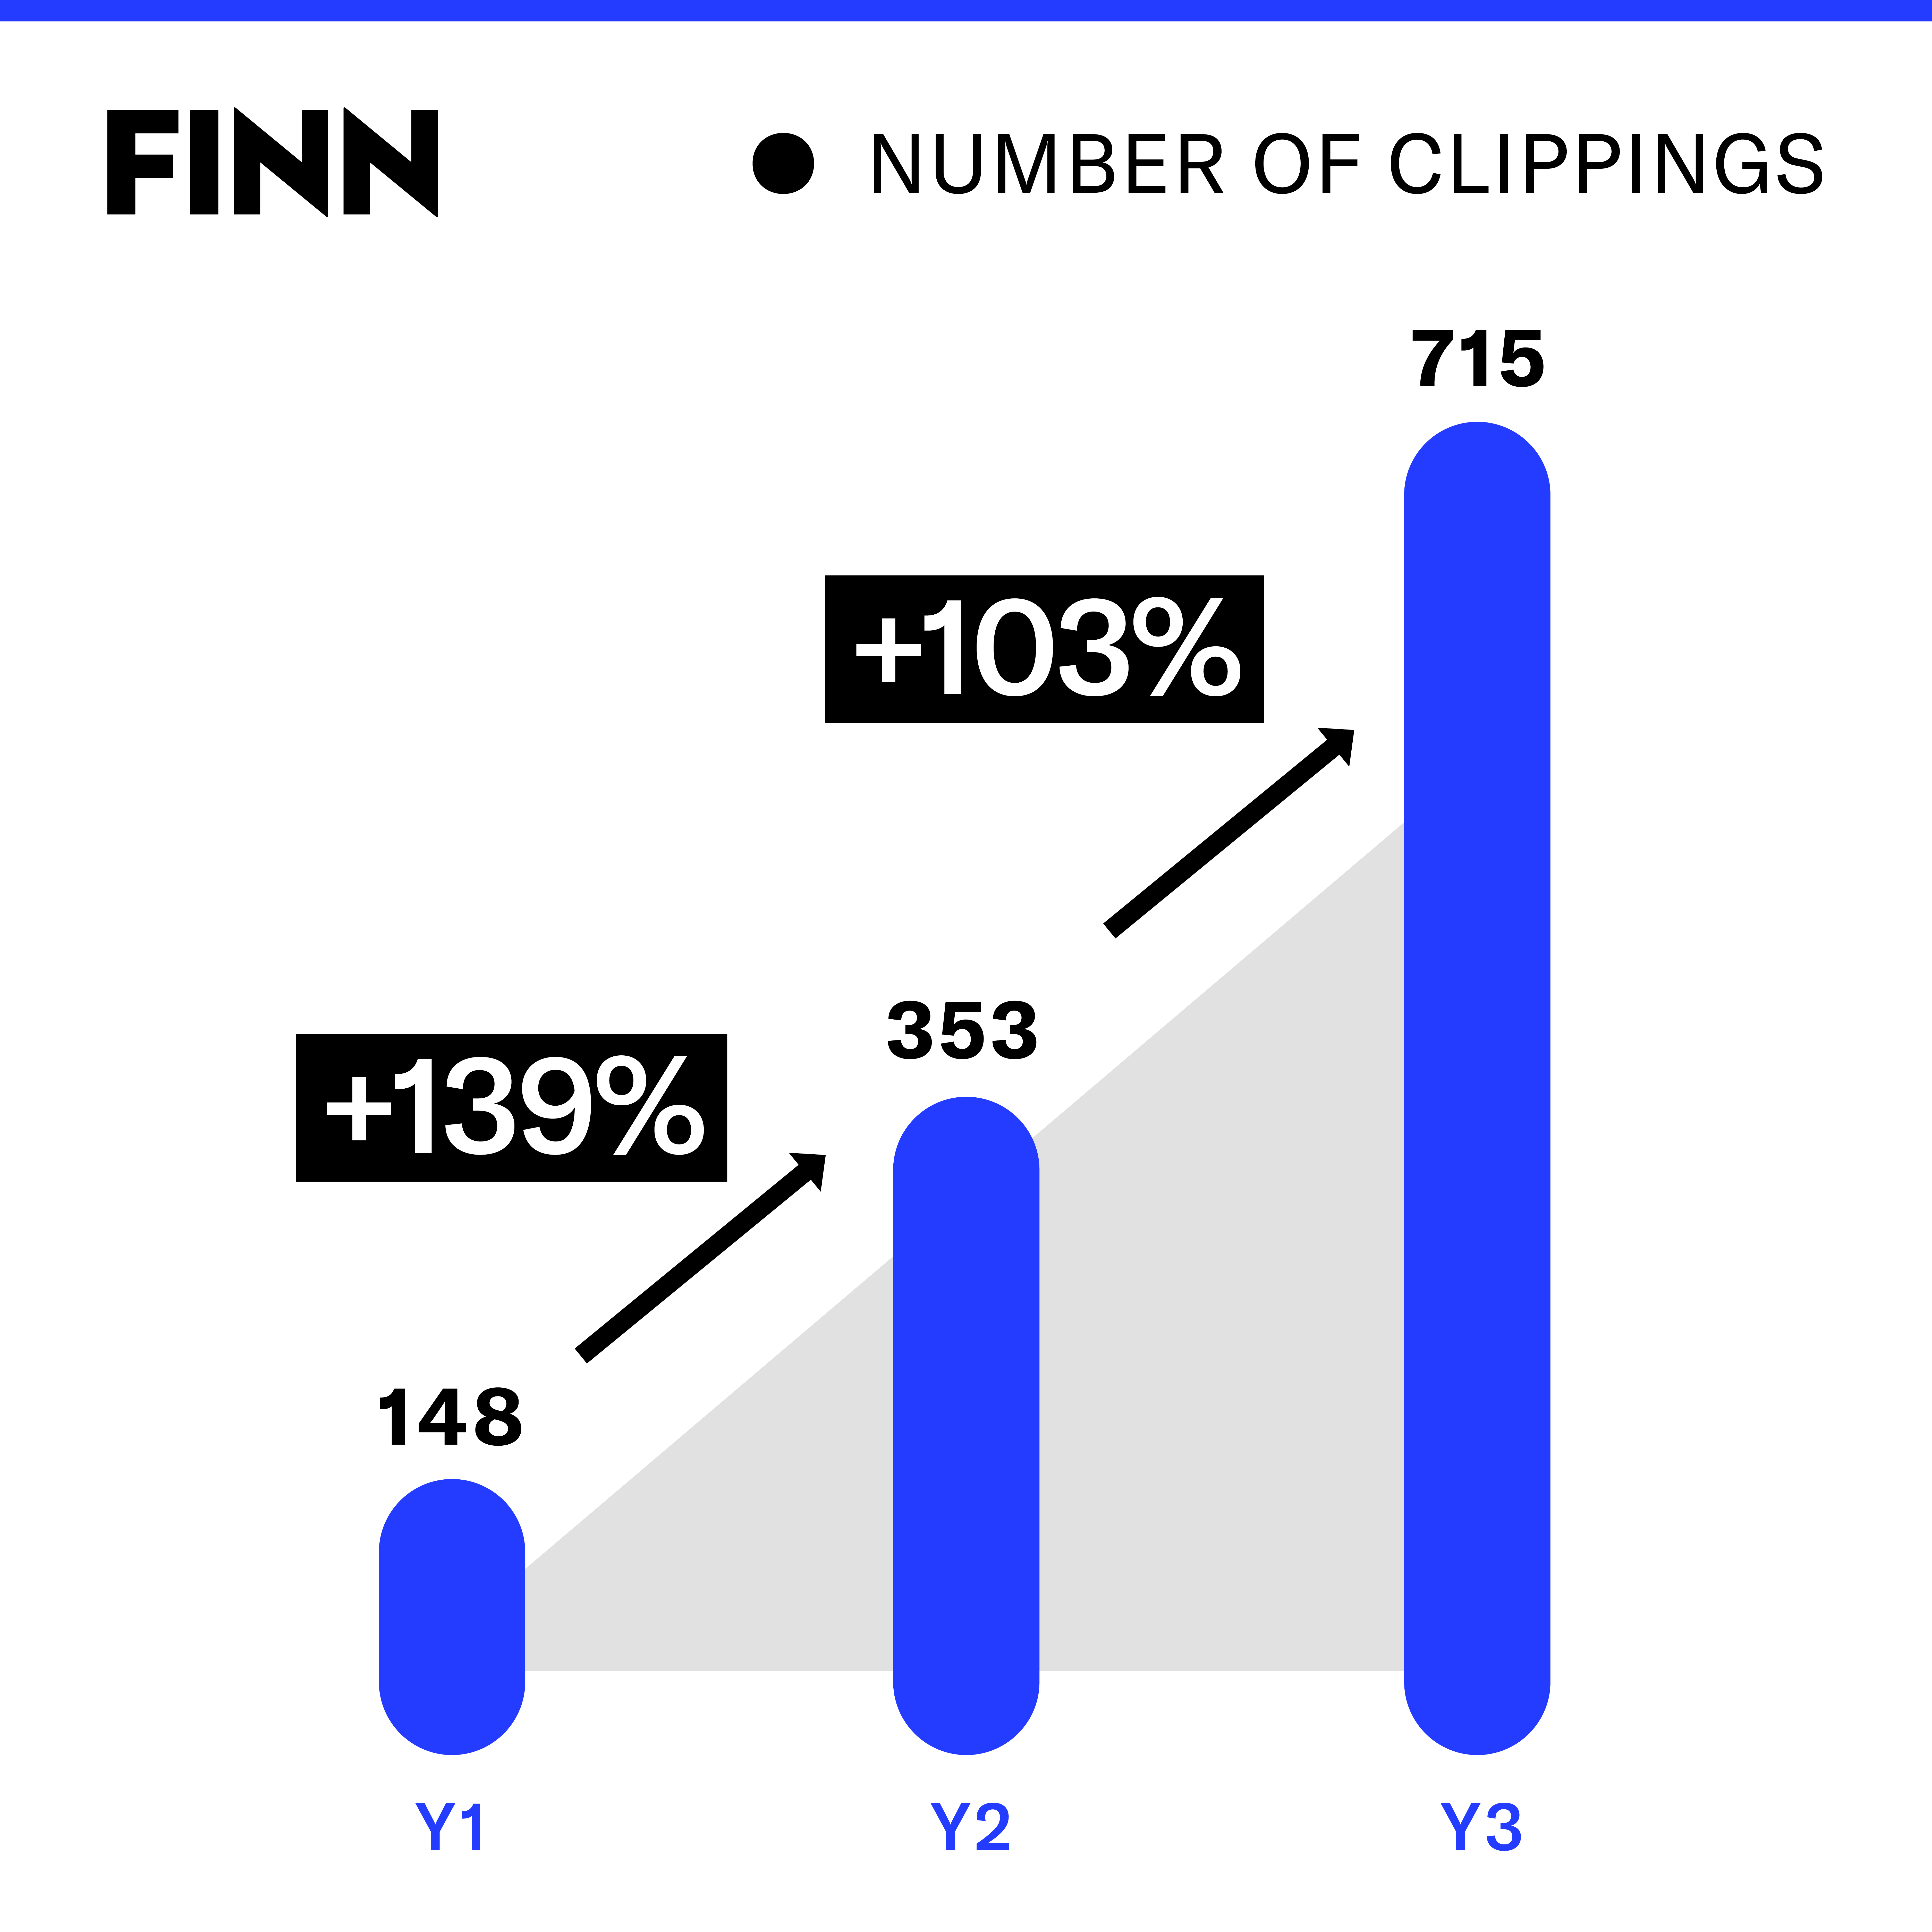
Knowing how often your brand or company appears in the media is useful as a baseline. That way you can see if there is growth in it over the years.
Two important caveats here: the clippings can of course be negative, so you can’t tell from these numbers how your brand is doing in the media – and how it is perceived by the public.
2. Number of clippings per PR campaign
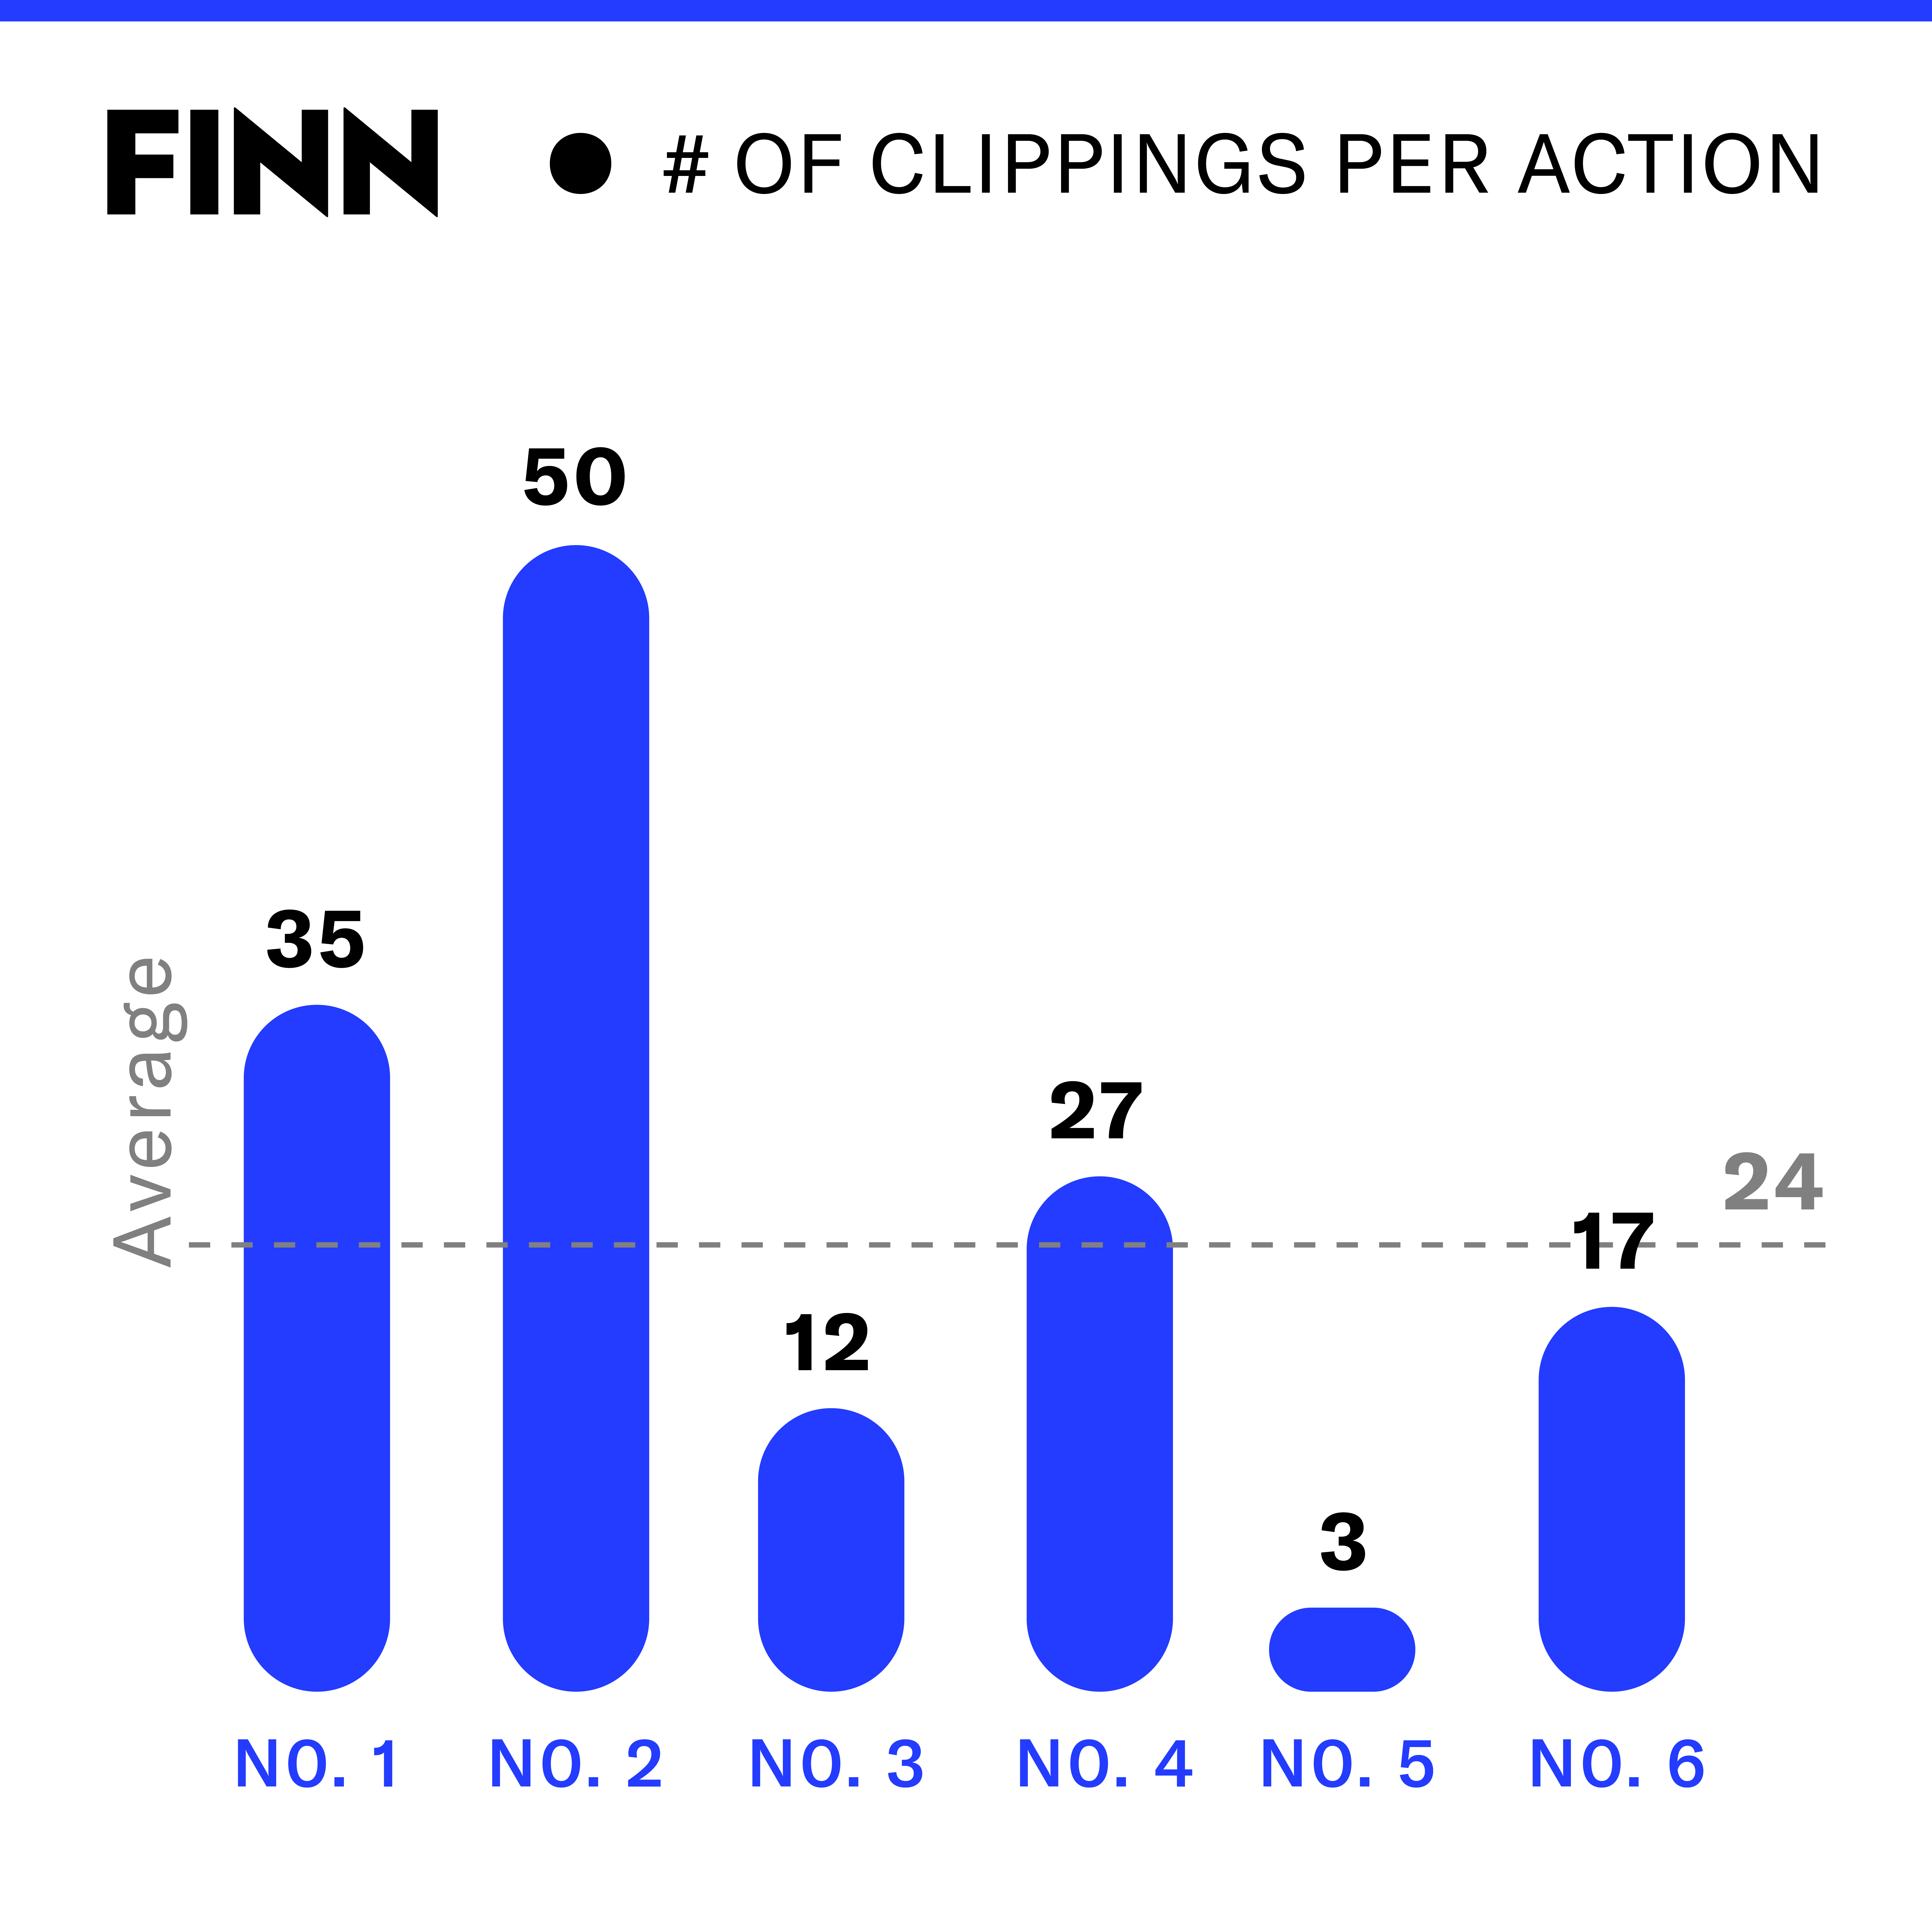
If you do PR successfully, more effort (output) should also result in more clippings (outcomes). This makes sense, but a higher frequency of PR should also eventually result in more clippings for each action.
If you communicate four times a year and score a clipping or four each time, you should be able to get to six clippings per action, or even more, with eight communications per year.
Communicating more should have an amplifying effect on your PR. Make sure to measure the average number of clippings per action and check if these are on the rise.
3. AVE (advertising value equivalent) of your PR efforts
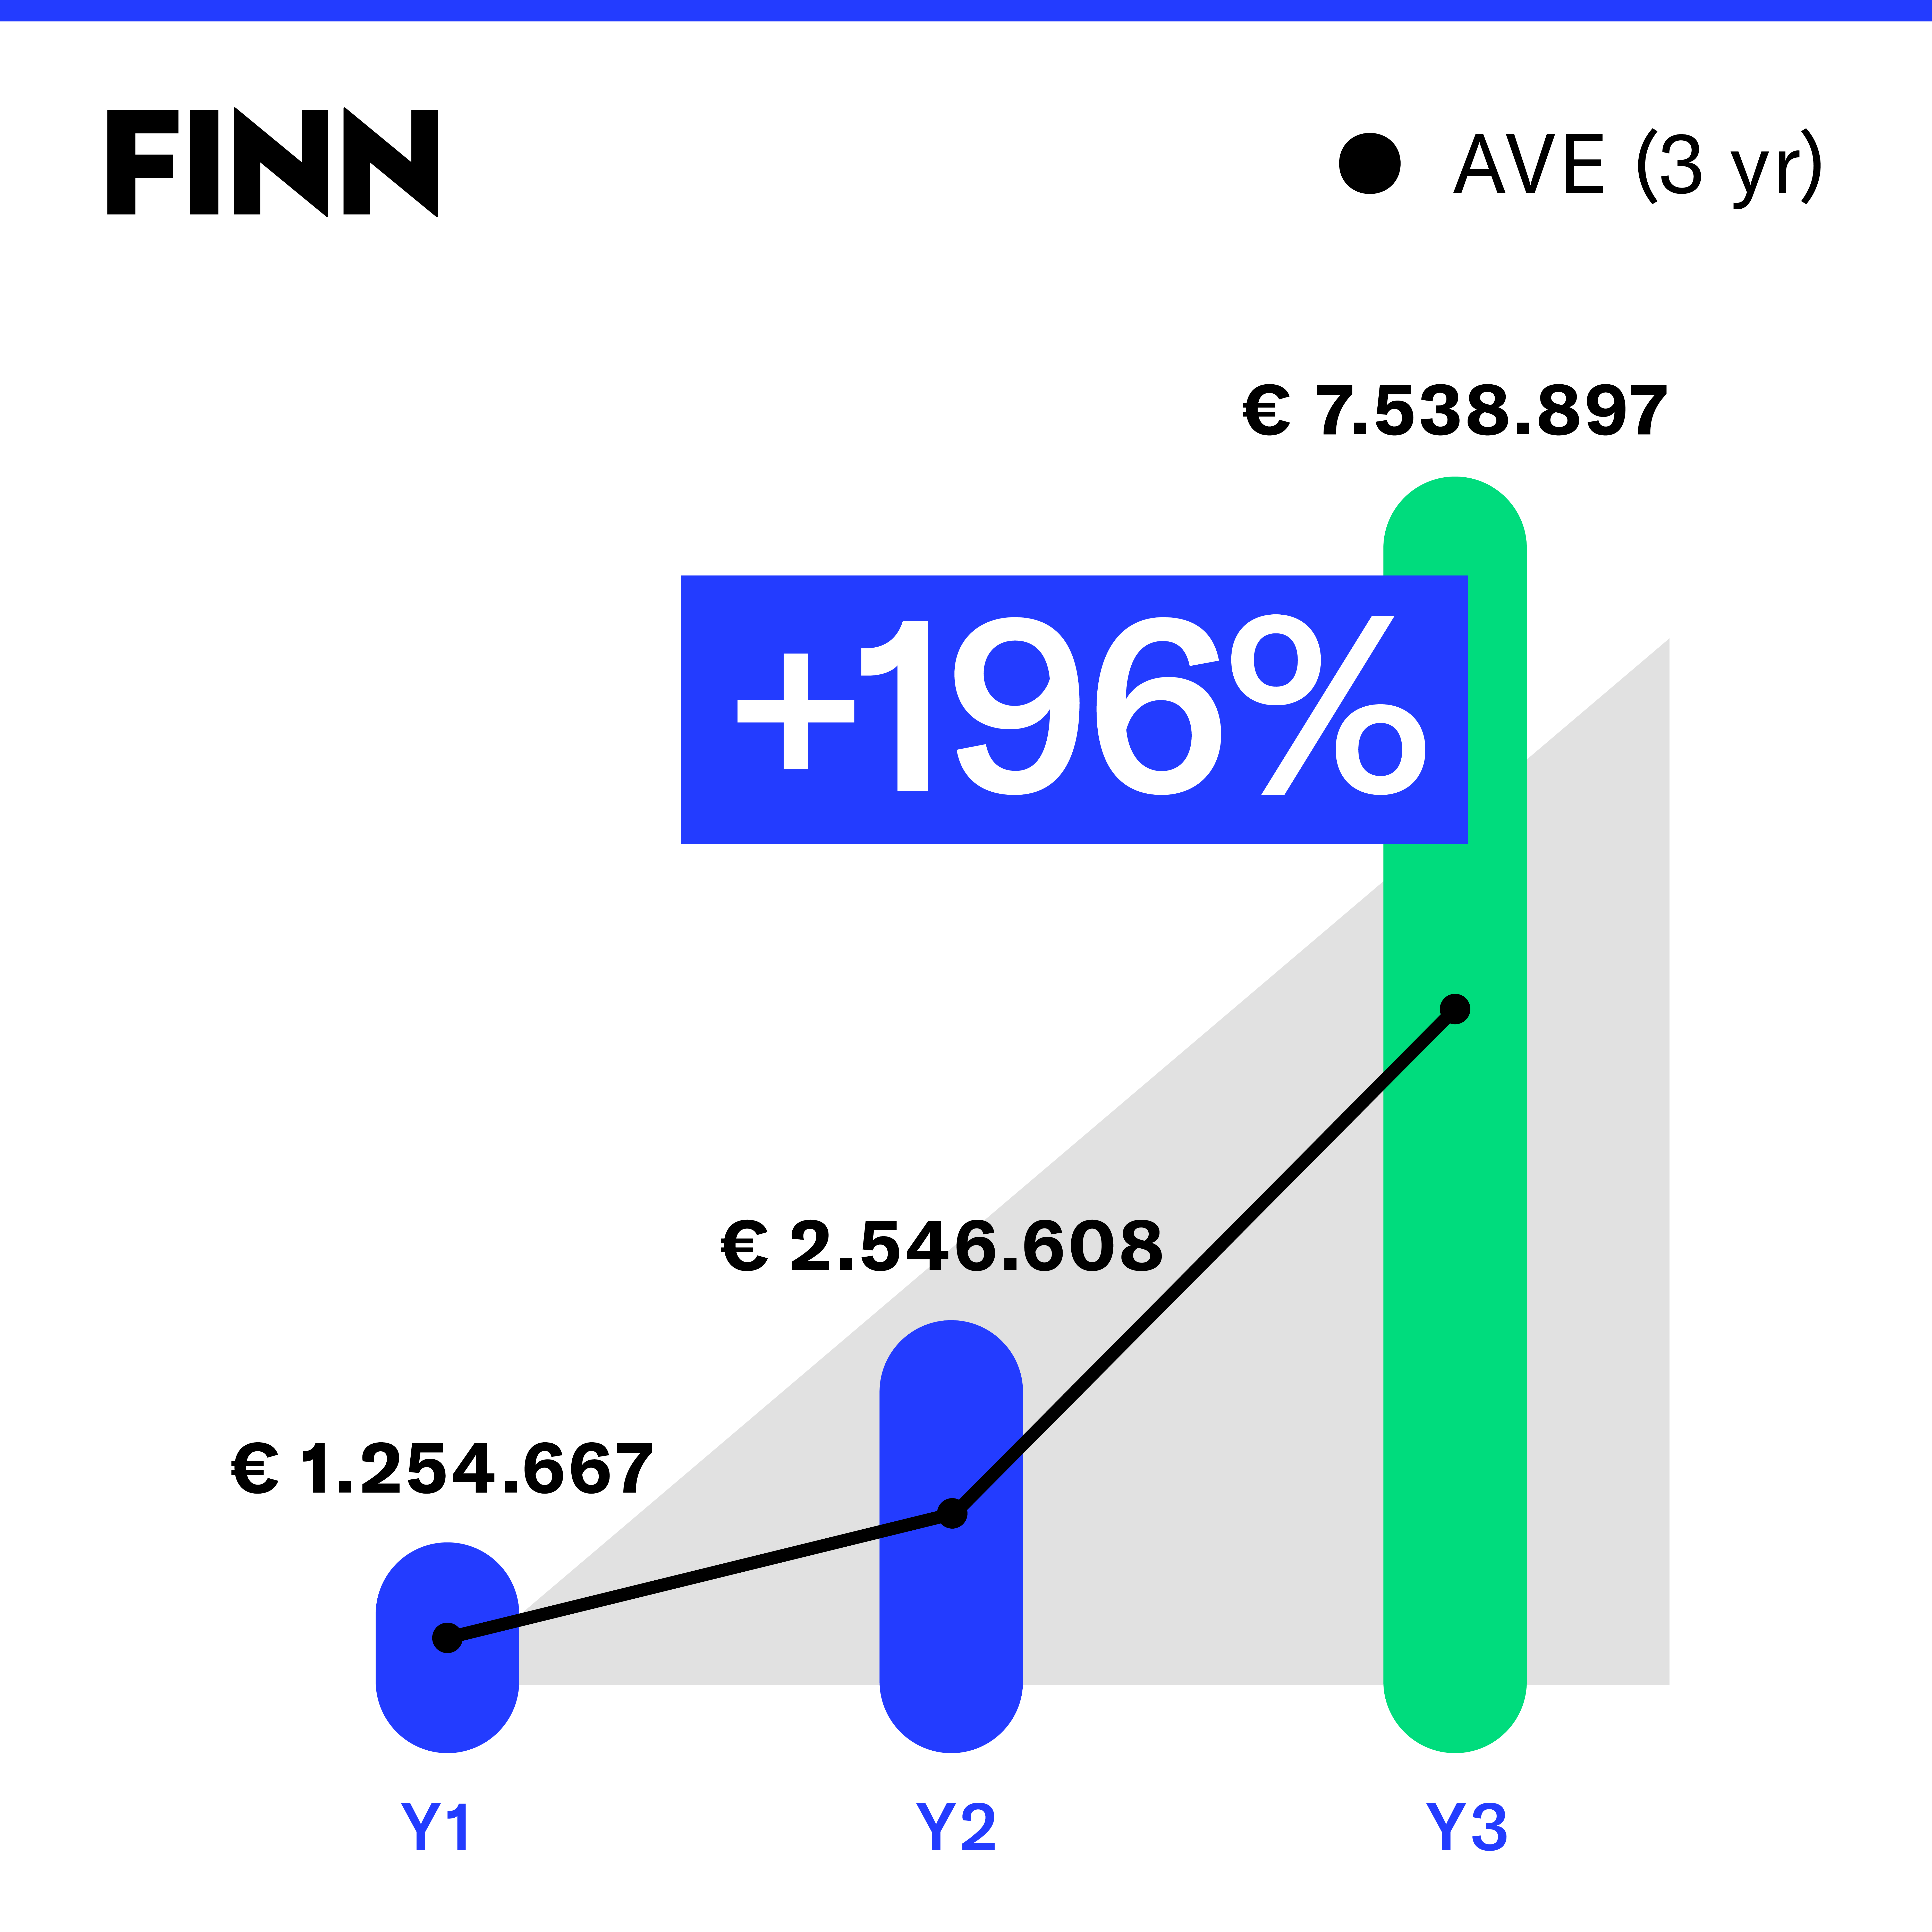
This KPI measures the value of your PR based on the price you would have to pay for a similar ad space. “Serious” PR people often hate AVE, for several reasons.
First, because editorial attention is worth more than an ad, but also because assigning a monetary value suggest that you can use AVE figures to calculate some kind of return on investment (ROI) from PR, which is obviously not true. In fact, AVE value is not cash you get in your account. As a stand-alone KPI, AVE is fairly worthless.
AVE is especially useful for comparison purposes as a kind of “synthetic” KPI. AVE takes into account media reach, the type of target audience (business or consumer), the prominence of the media coverage, and often whether there are photos and quotes included in the media coverage. AVE allows you to compare apples to apples: AVE for your brand this year versus last year’s AVE. Your brand’s AVE versus competitors’ AVE.
In that sense, it is useful – just don’t oversell it’s importance to your management.
4. Does your PR result in Tier 1 or Tier 2 (or Tier 3) media coverage?
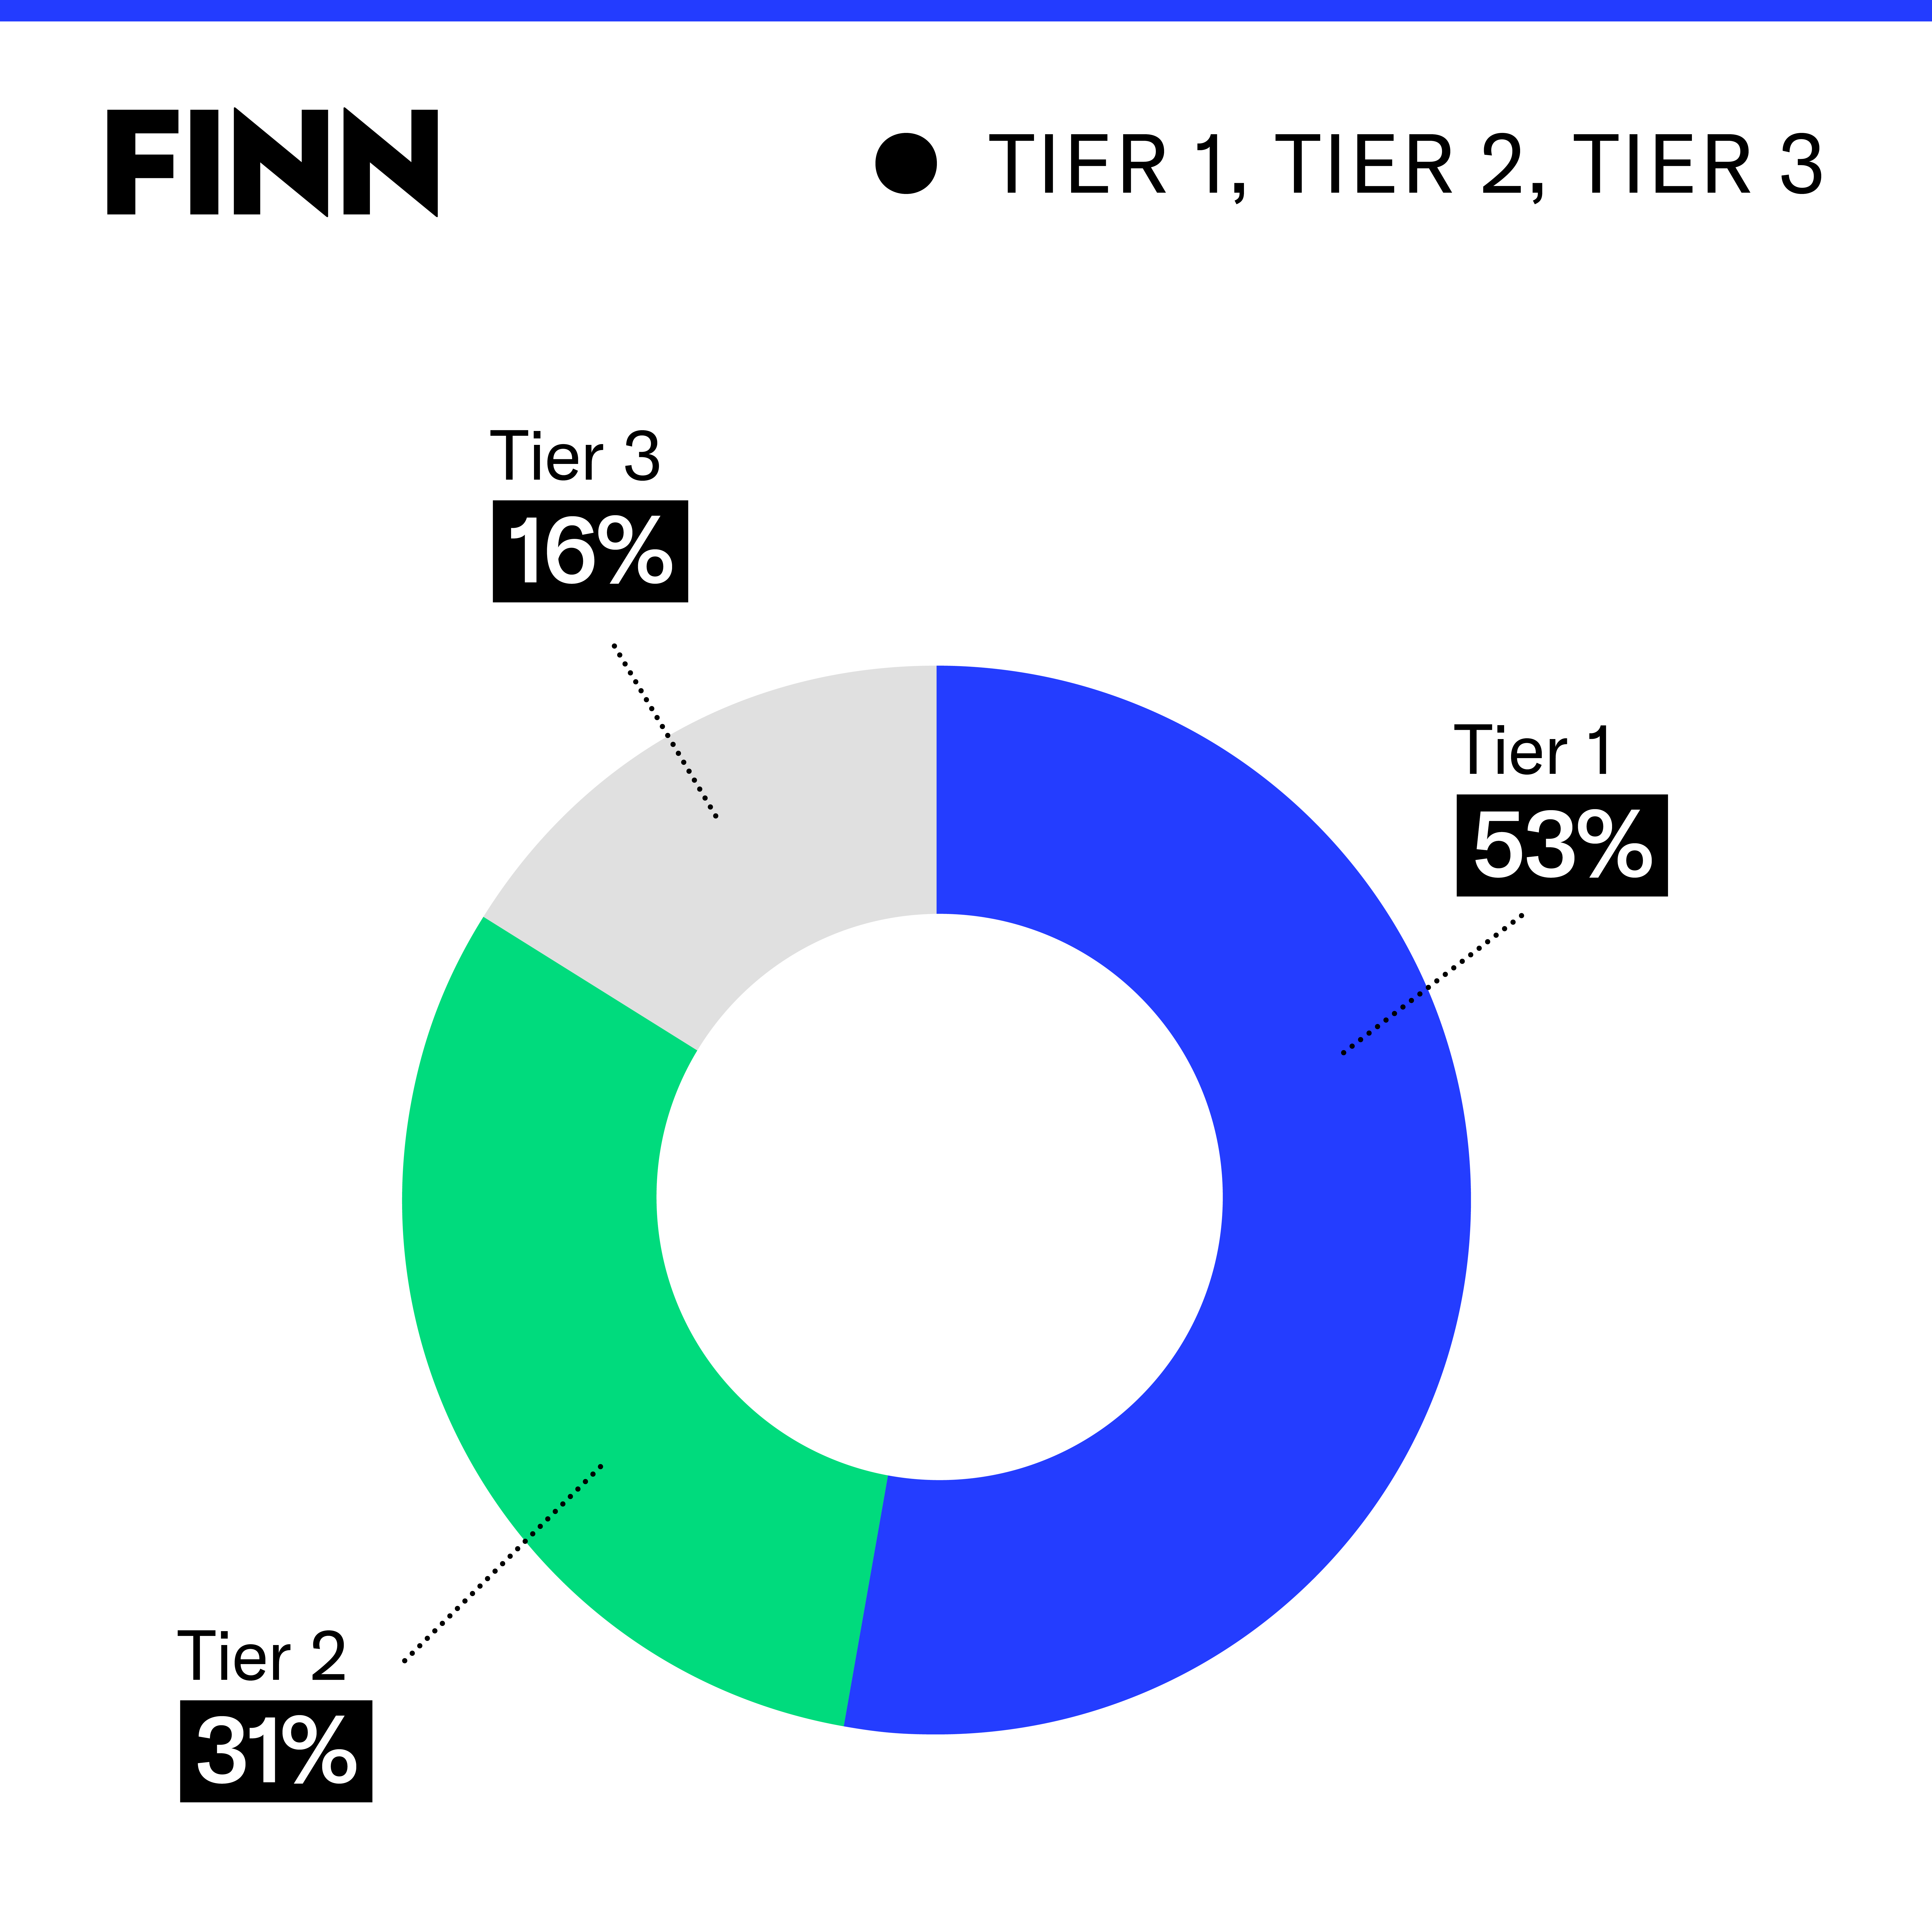
At FINN, we distinguish between “Tier 1,” “Tier 2” and sometimes “Tier 3” media. Which media are Tier 1 for you and which fall into another category depends on your industry.
In general, major consumer media (VRT, HLN) and major business media (Bloomberg, Financial Times, De Tijd) are Tier 1, as well as major international trade media. In Tier 2, then, we are more likely to find regional media or smaller trade magazines.
5. Share of voice in earned media
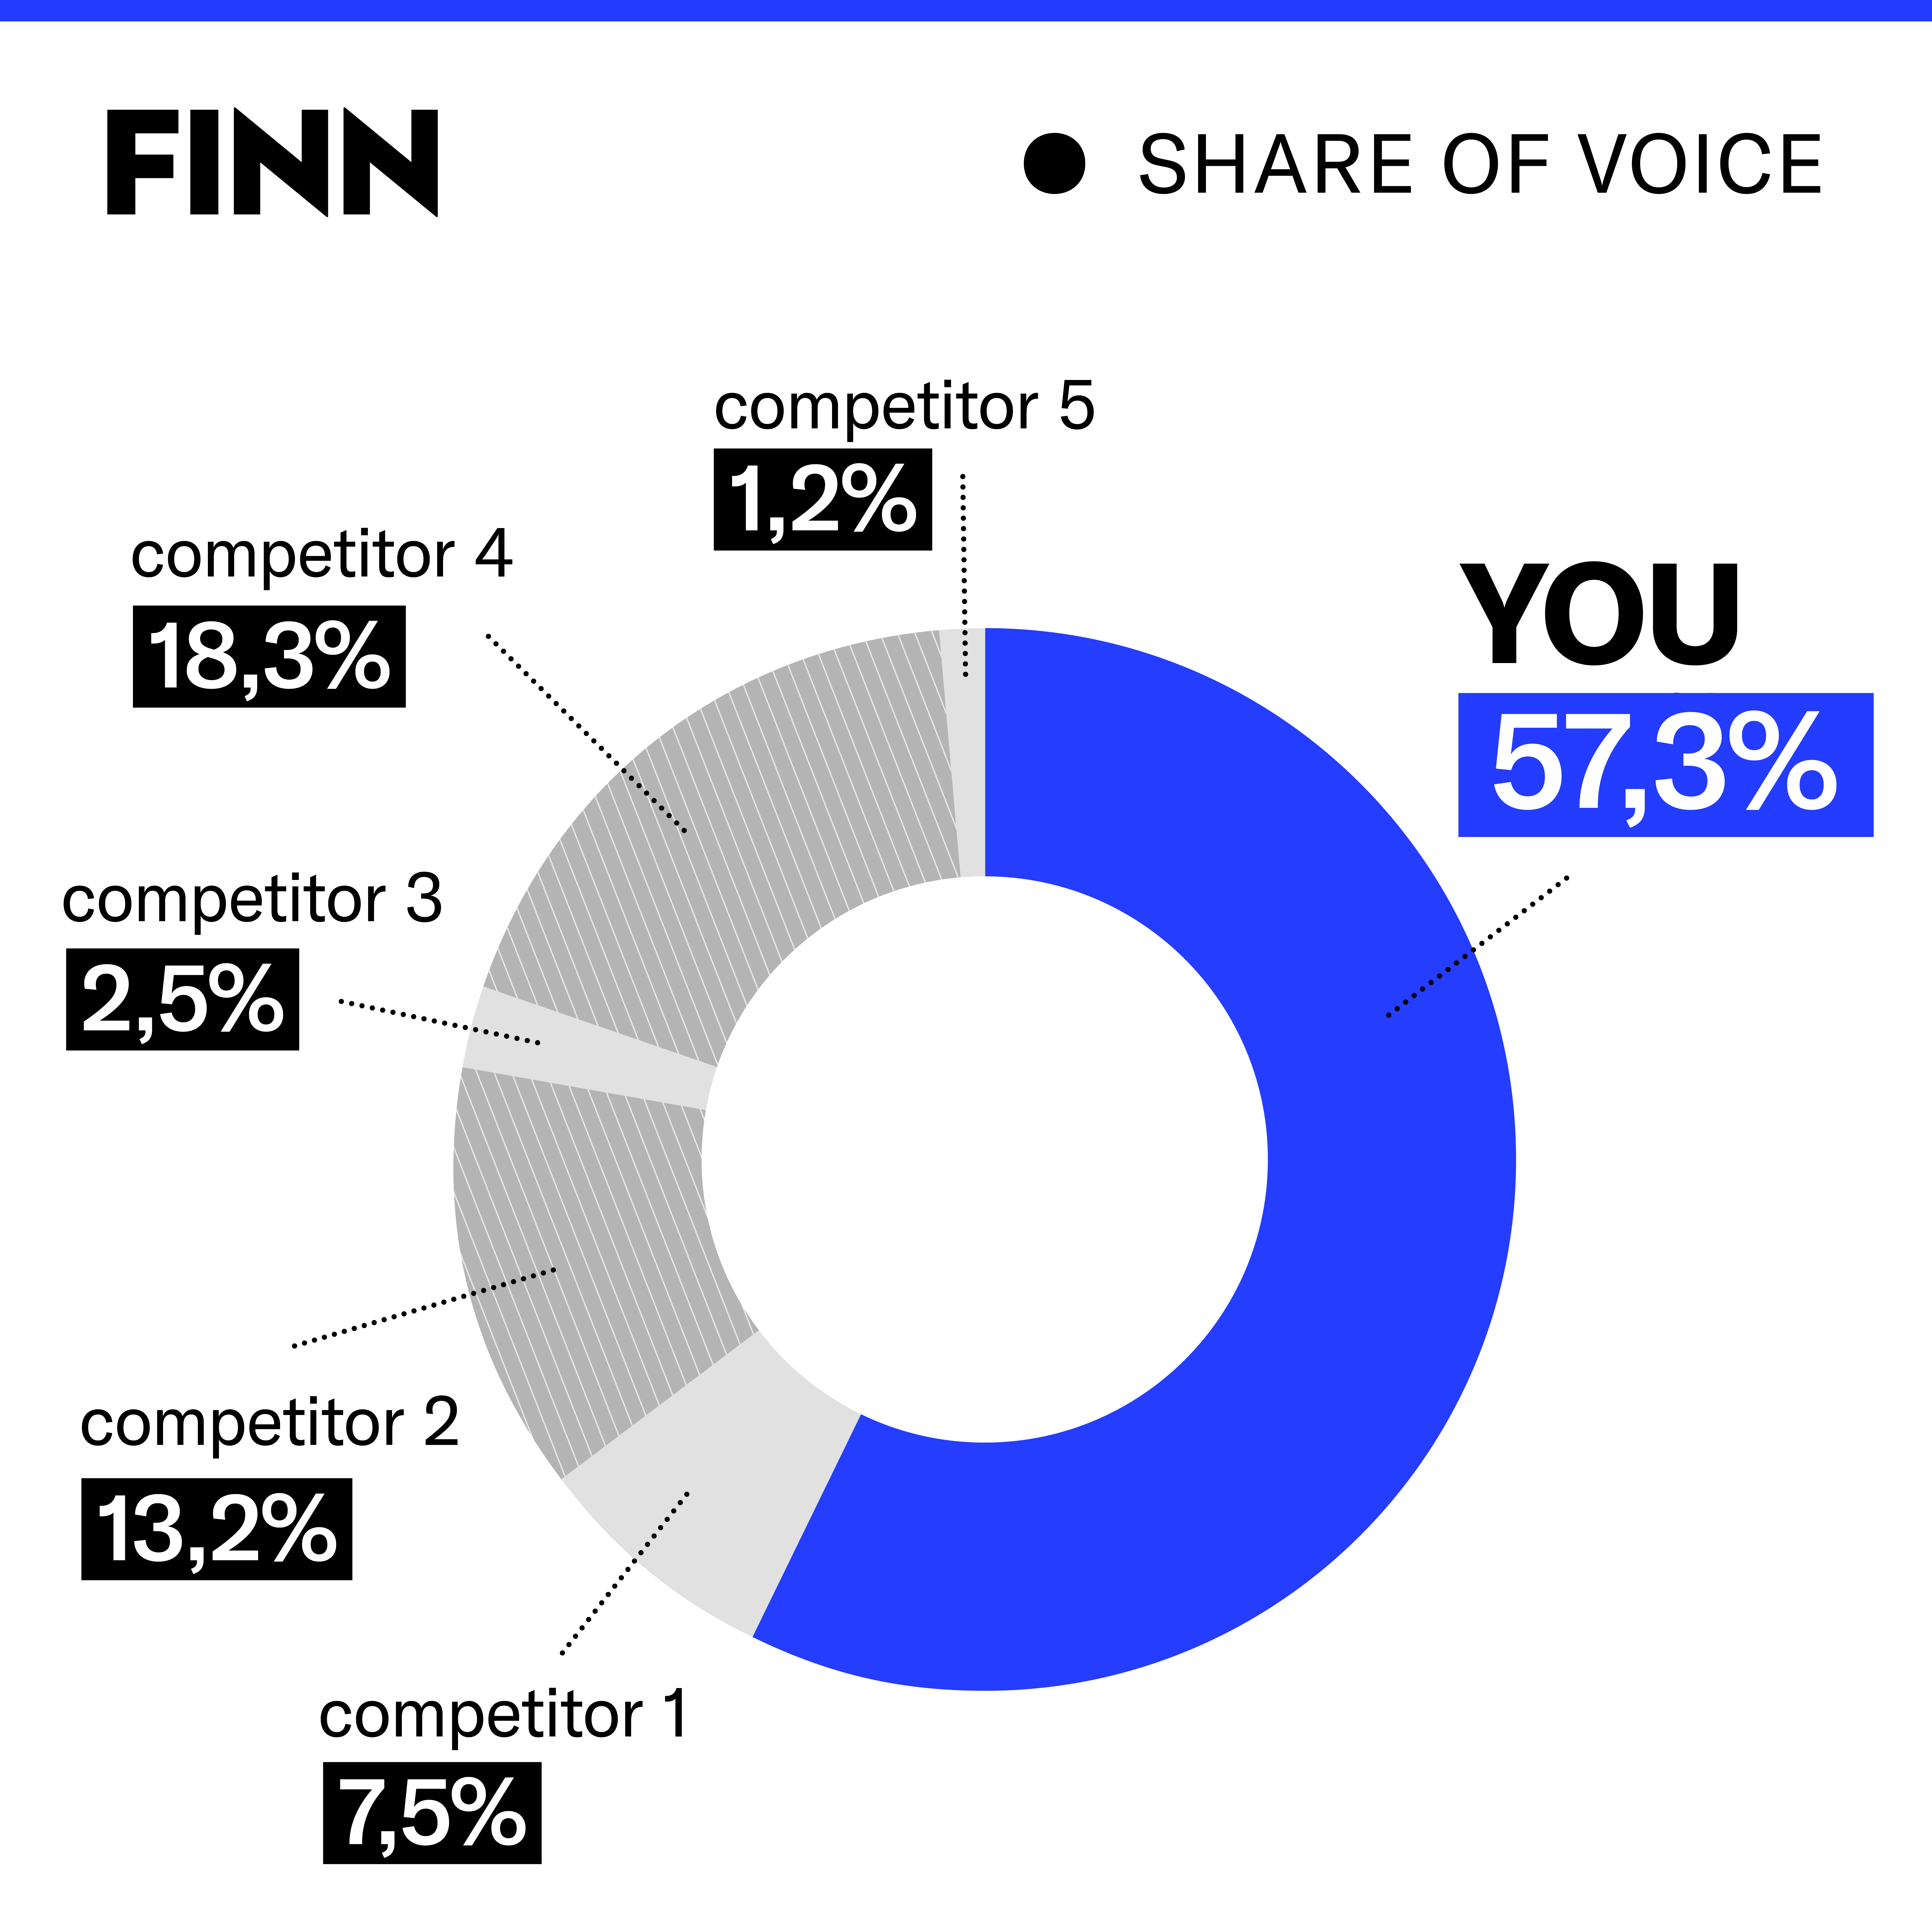
How much more attention can you claim than your competitors? An important question for challengers: do you manage to punch above your weight? In other words, do you get more media attention than your brand deserves based on your market share?
If so, you have “excess share of voice” and may really be building your brand through PR. That’s what we at FINN strive for with our clients.
6. Number of ‘inbounds’
Do journalists (and by extension other stakeholders) spontaneously call you when they want answers to questions in your industry? Even though the number of inbounds is usually very low, they are very significant. In start-up PR, you will get phone calls from a journalist maybe once or twice a year. Over time, that should move toward 20 or more.
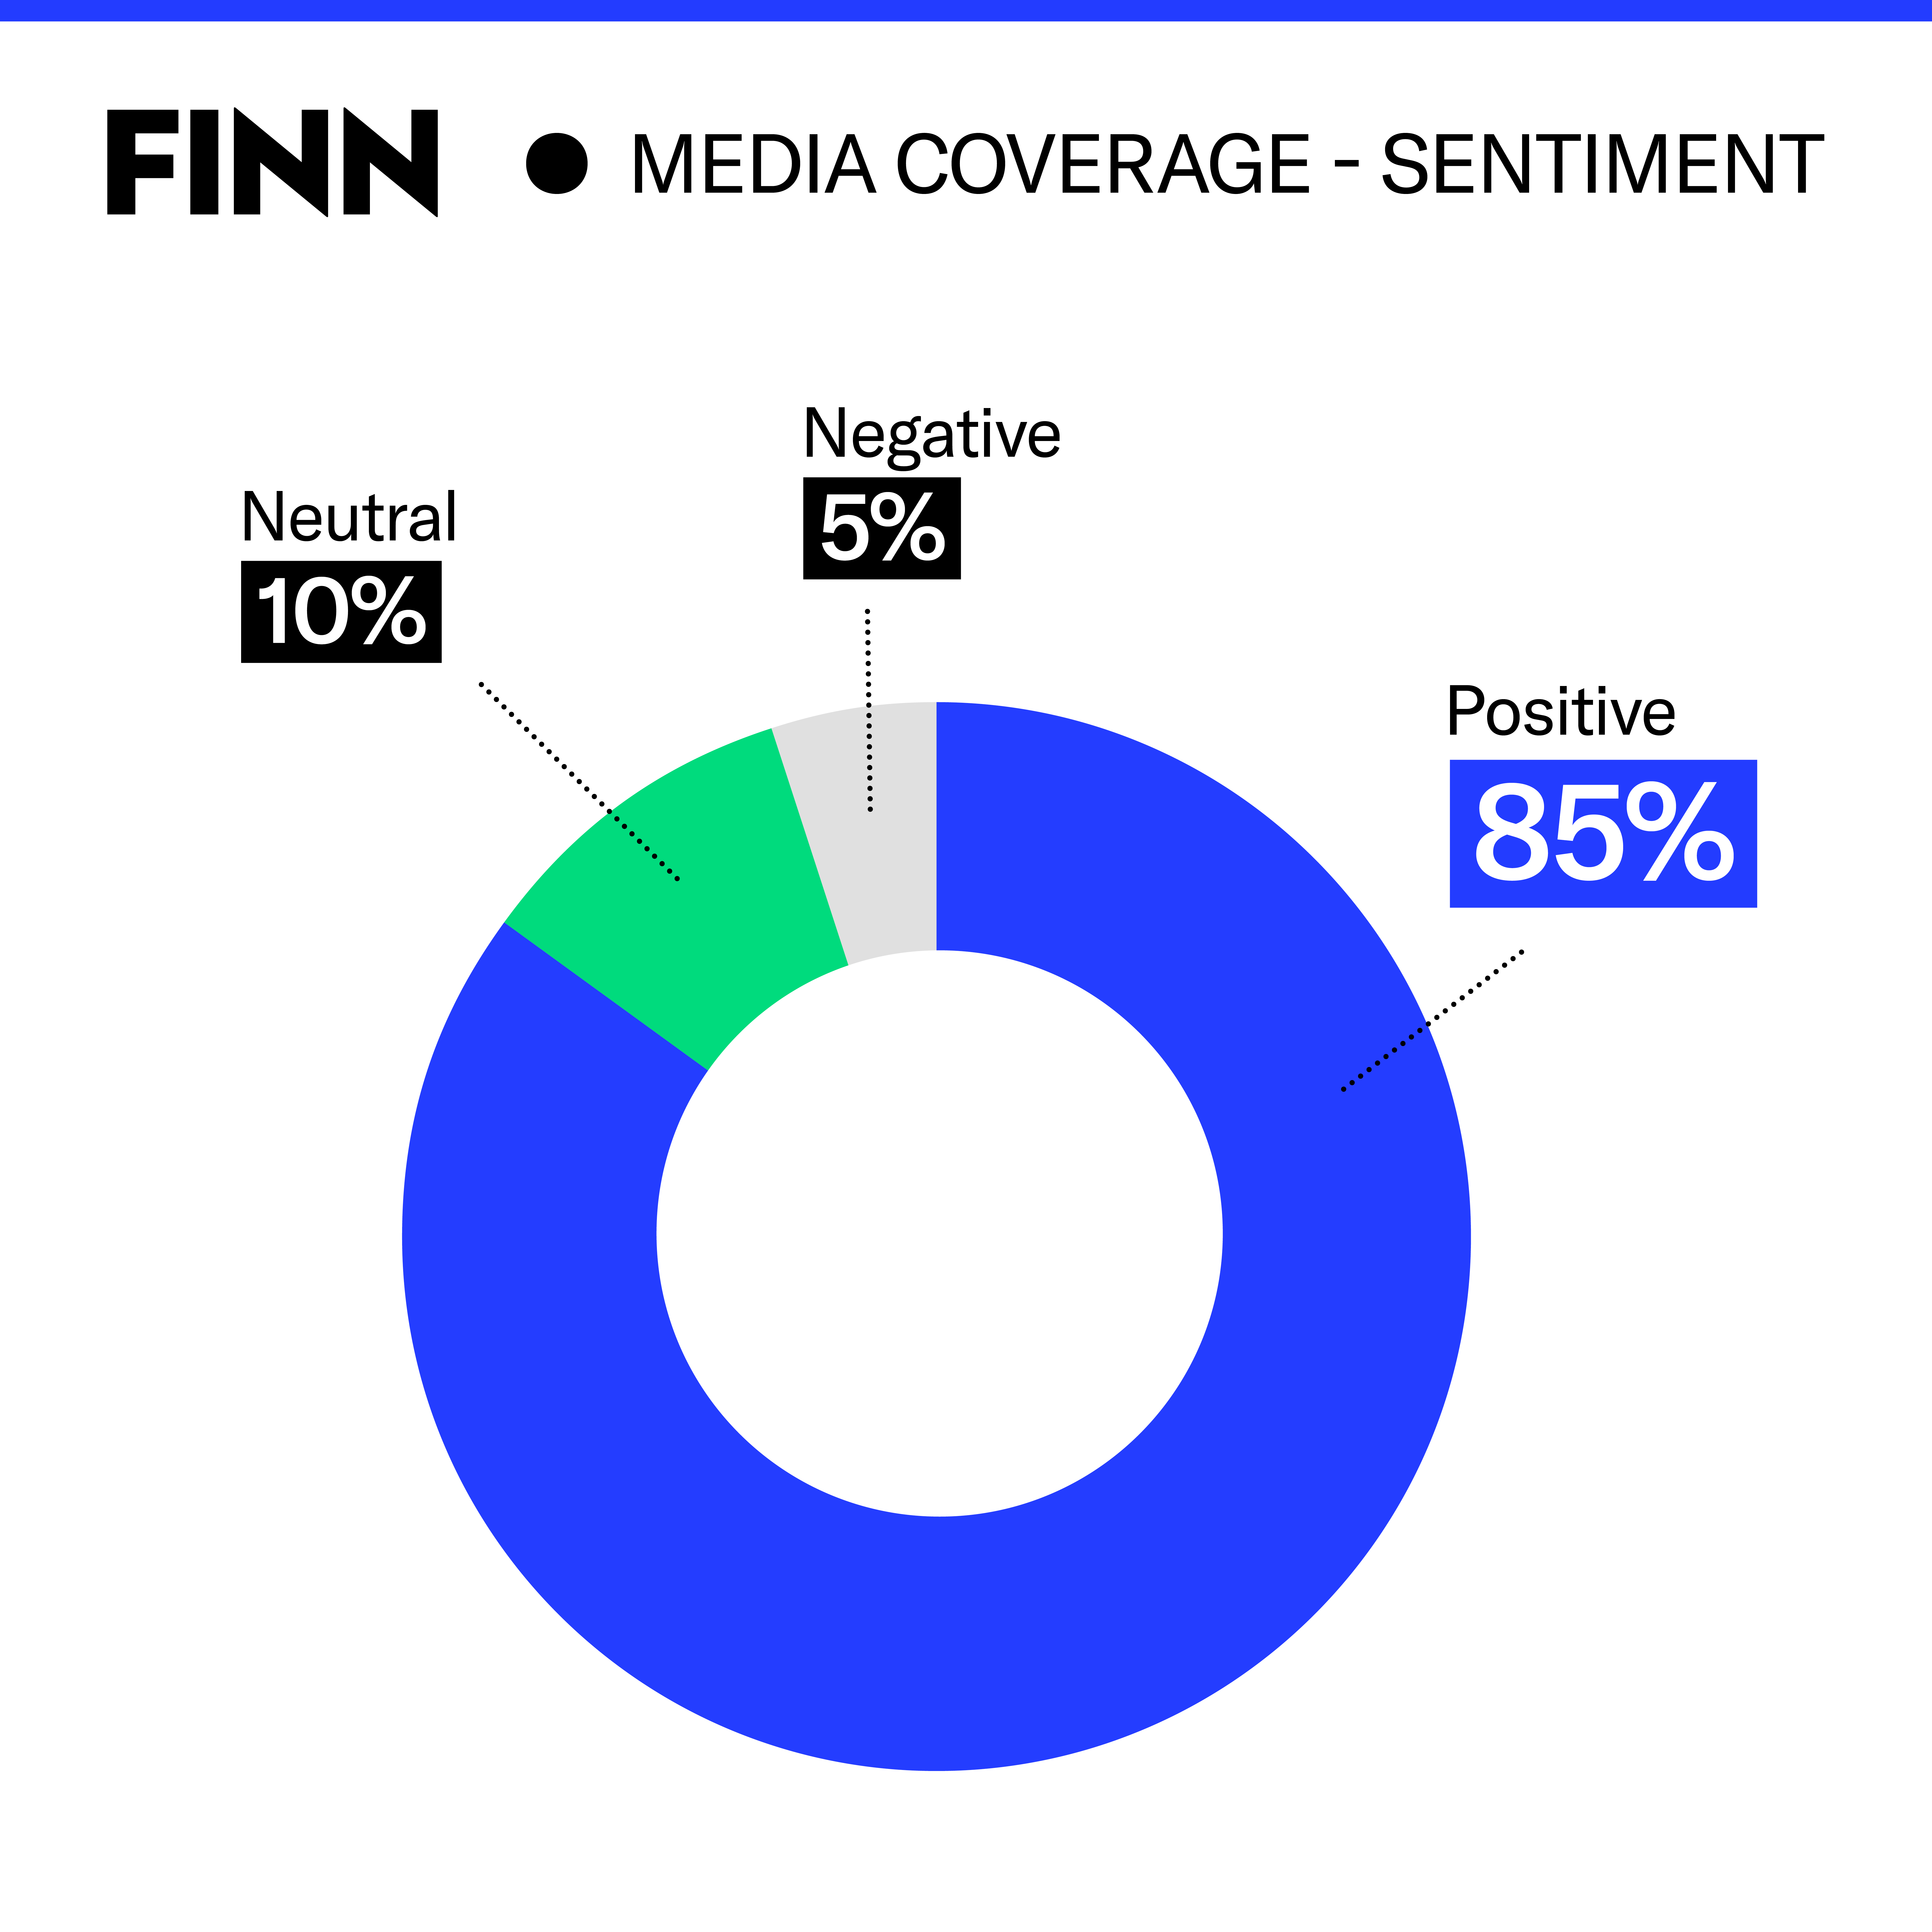
7. Sentiment
Qualitative metrics are an important complement to quantitative metrics. For example, you can analyze in depth how messaging resonates, what emotions it evokes, and how it reflects an organization’s core values.
8. Media reputation index

Media reputation index is a metric developed by academics that reflects how positive coverage of your brand is, similar to NPS scores.
9. Messages and attributes (“agenda setting”)
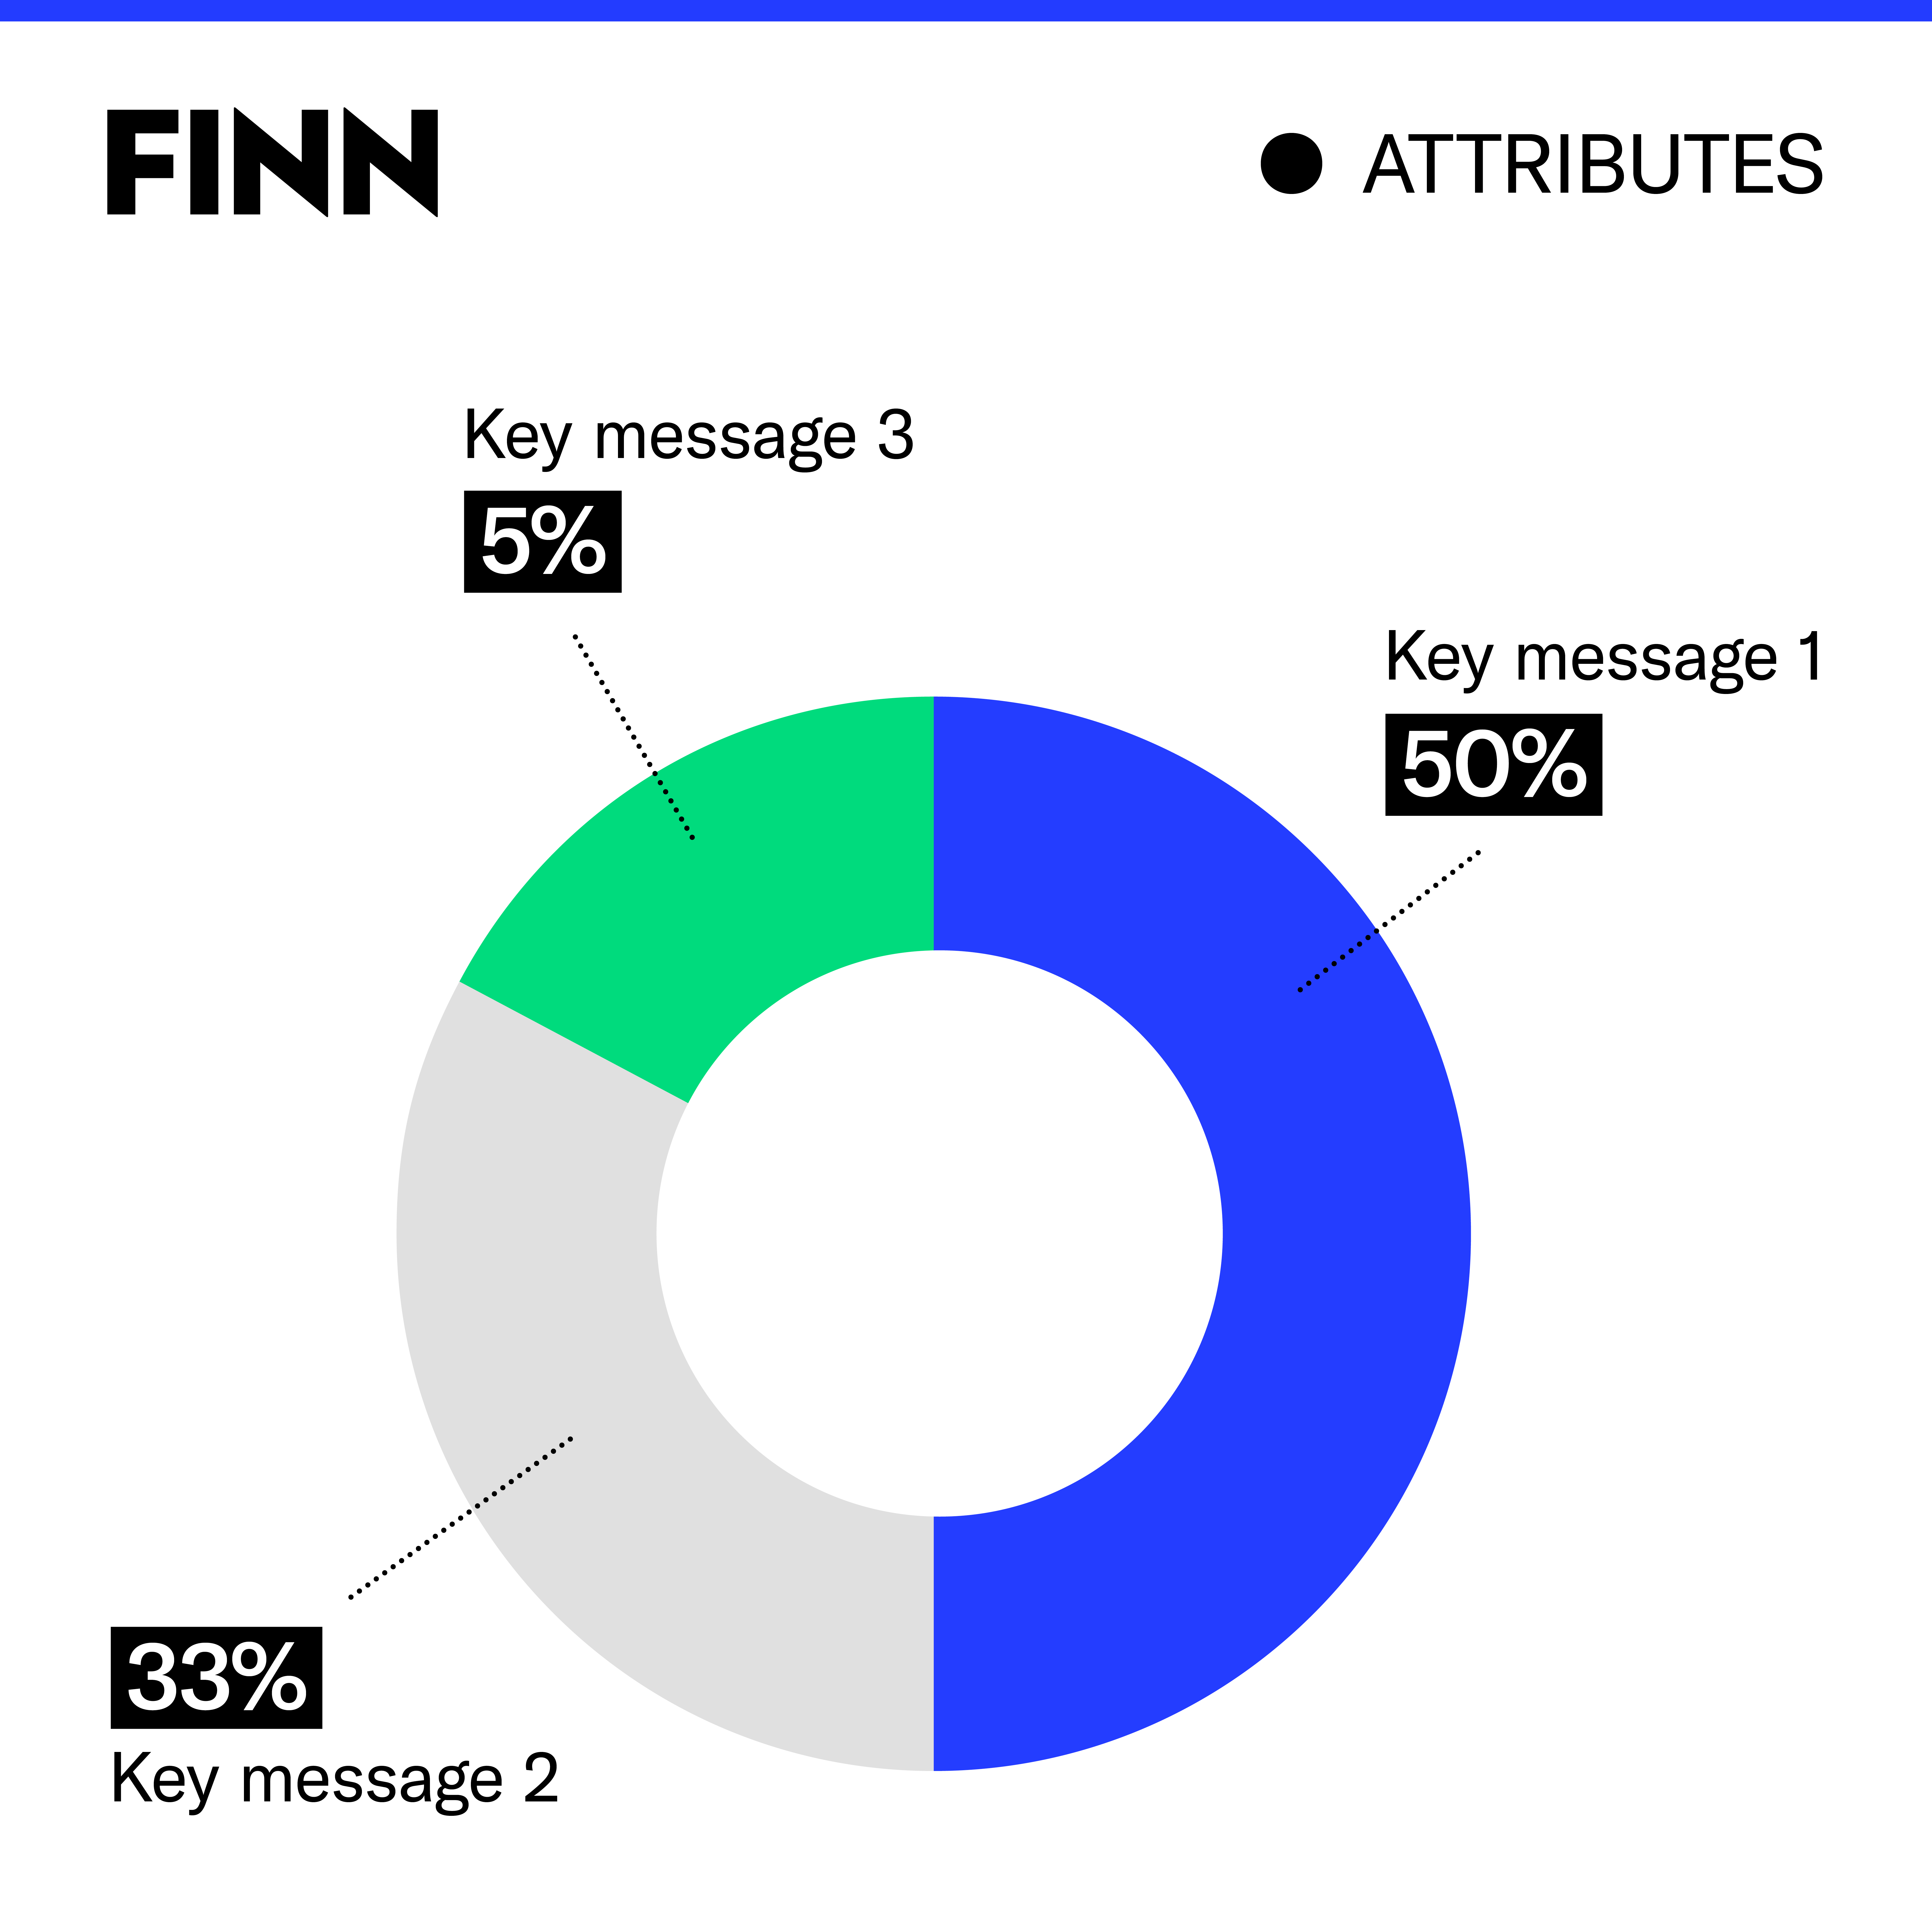
For many clients, we also determine together a set of key messages and attributes (e.g., “innovation”). For each piece of media coverage, we then indicate whether any of the strategic messages or attribute appear in the piece, and if so, which ones. In this way, first of all, we can demonstrate that the media coverage is strategic – that we succeed in correctly linking the brand to certain qualities we want to highlight. Second, it allows us to track which messages score best in the media. Research shows that these messages that are linked to brands in media also end up being associated with the brand by the general public – this is what we call “agenda setting.”
10. Talk and share metrics
What is the reach and engagement on social media when a news story appears about your brand or company? Through this metric you not only find out if something “lives”, several services also offer sentiment analysis based on natural language processing (NLP). So you do get to know better what people are thinking/feeling.
At FINN, we use a balanced mix of these metrics (and sometimes, more custom metrics) for a more complete and in-depth picture of how an organization is really doing in its PR efforts. Feel free to contact us if you would like to get the full picture yourself.